We have conducted our annual survey to improve our service to the end-user community. Respondents were asked for their opinions on various topics related to anti-virus software testing and anti-virus software in general. We would like to thank everyone who took the time to complete the survey. This survey can be downloaded as PDF from here.
IT Security Survey 2019
Survey Period: 14th December 2018 – 24th December 2018
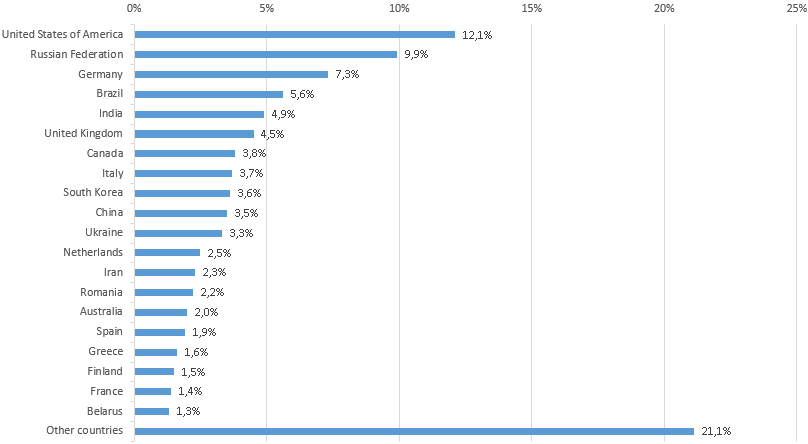
Valid responses of real users: 3,302
The survey only ran for 10 days this year. It contained various control questions and checks which helped us to identify and remove nearly 1,000 invalid responses from just a few users who tried to game the survey, presumably to win a licence; these were all disqualified and removed.
The survey results are invaluable to us. This report contains the results of the survey questions.
Overview
Use of the Internet by home and business users continues to grow in all parts of the world. How users access the Internet is changing, though. The increase in the use of smartphones and tablets to access the Internet has continued, and this has resulted in a drop in desktop and laptop sales. With regard to attacks by cyber criminals, this means that their focus has evolved.
This annual survey of computer users worldwide focuses also on which security products (free and paid), operating systems and browsers are most widely used.
Survey methodology
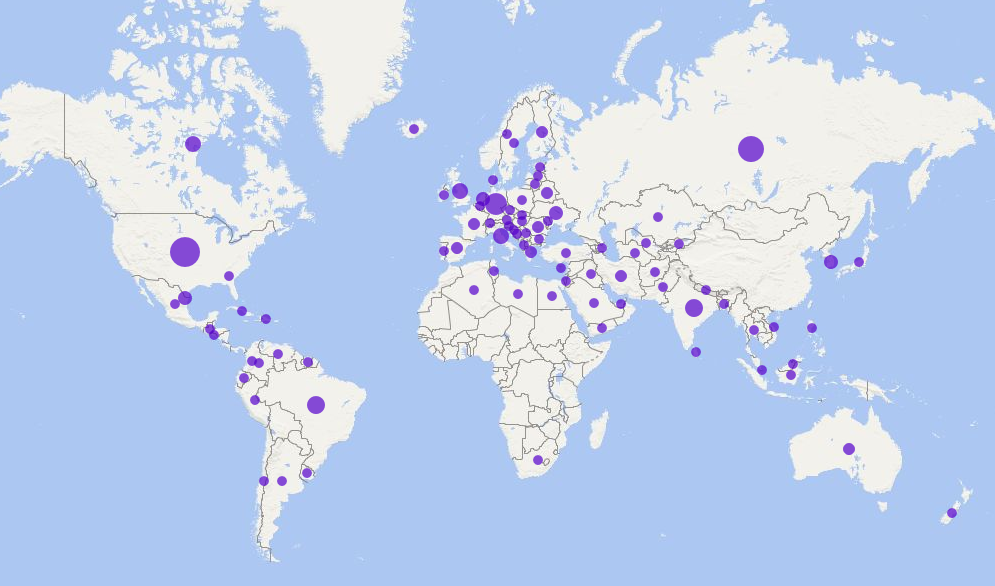
Report results are based on the Internet survey run by AV-Comparatives between 14th December 2018 and 24th December 2018. A total of 3,302 computer users from around the world answered the questions on the subject of computers and security.
Prize draw
This year, to say thanks for taking part in the survey, about every third randomly selected participant will get a one-year license for a security product. The licences were kindly provided by their respective vendors: Avast, Avira, ESET, F-Secure, K7 Computing, Kaspersky Lab, Panda and Trend Micro. Our thanks go to these manufacturers for making the licences available.
Key Results
Please note that all the points made below refer only to our survey participants, not the general public.
- Avast, Bitdefender, ESET, Kaspersky Lab and Microsoft (ordered alphabetically) are the five most popular desktop security products worldwide, and feature in the top five products on every continent with significant results.
- Kaspersky Lab is the most popular mobile security solution in absolute number of votes, while Bitdefender and ESET are the only two found in the top three on every continent.
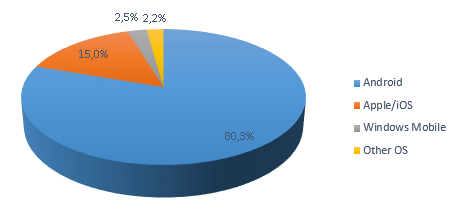
- Android remains by far the most popular mobile operating system, being used by four fifths of respondents. iOS is the only other mobile OS to reach double figures, at 15%.
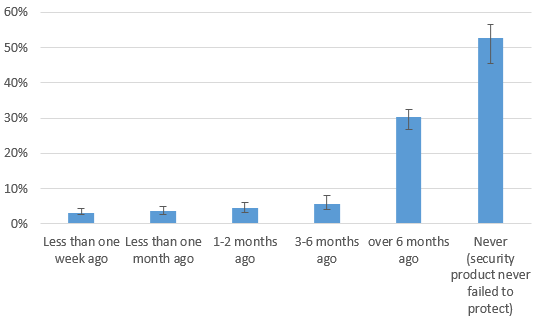
- A majority of users (86%) were well protected in the last 6 months, having not suffered a malware infection in this period. A little over a third (35%) stated that their security product had blocked malware within the last week, indicating how easy it is to encounter a threat.
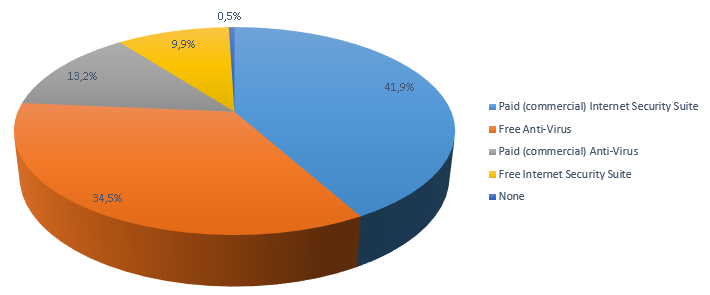
- The number of users who rely on free desktop security software has risen again this year, standing at 44% of users. There has been a drop in the number of users without antivirus software, which is now down to 0.5%.
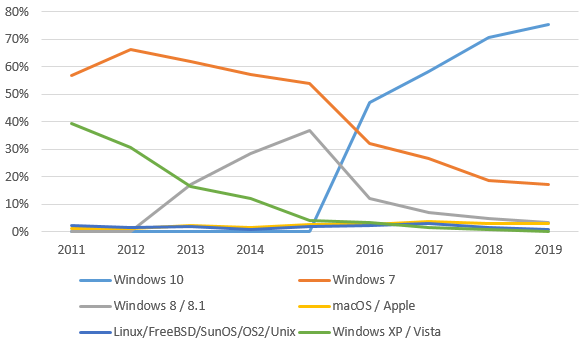
- Over three quarters of this year’s respondents have moved to Windows 10, leaving Windows 7 with under a fifth of users.
- A little under a half of respondents (45%) use a Virtual Private Network (VPN). In Iran, UAE, Iraq and China, at least three quarters of users deploy a VPN.
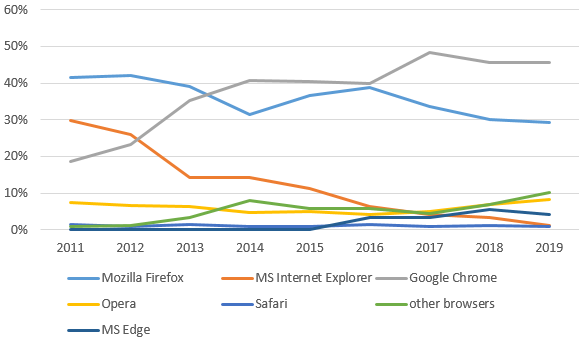
- Google Chrome is the most popular browser, with getting on for half of respondents (45.6%) using it. Mozilla Firefox accounts for a lot of the remaining users, with a share approaching a third (29.2%). Despite being built into the increasingly popular Windows 10, and being Microsoft’s recommended browser on this OS, Microsoft Edge is only used by one in 20 of users overall.
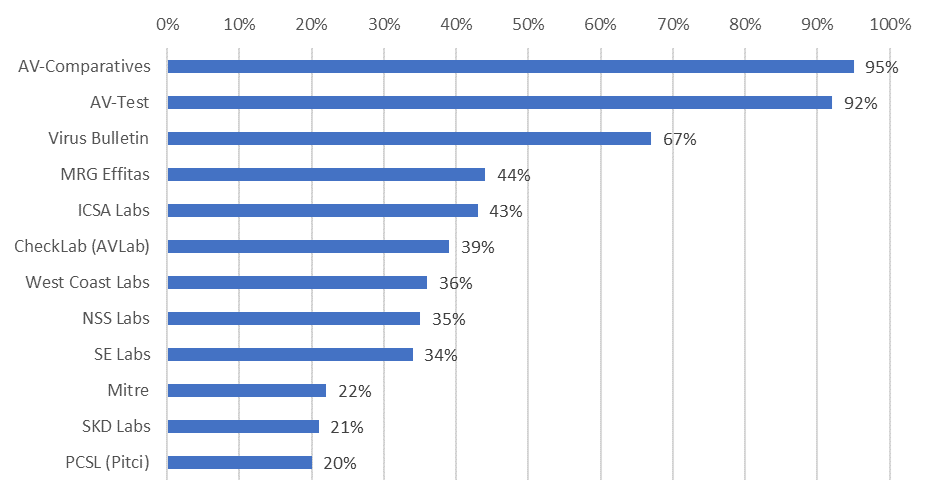
- Some of the 13 test labs we asked users about were much better known than others, with 95% having heard of AV-Comparatives, but only 19% recognising the least well-known lab. As regards user confidence, once again we are delighted to be voted the most trustworthy and reliable of the testing labs, and thank respondents for their confidence in AV-Comparatives.
We are grateful to everyone who completed the survey. The feedback we have gained will be used to ensure that our tests continue to grow in effectiveness and relevance. This enables manufacturers to further improve their products, benefitting both themselves and their users. We are very pleased to see our test results being quoted by other publications in their review of AV and Internet Security products! All AV-Comparatives’ public test results are available to everyone at no charge at www.av-comparatives.org
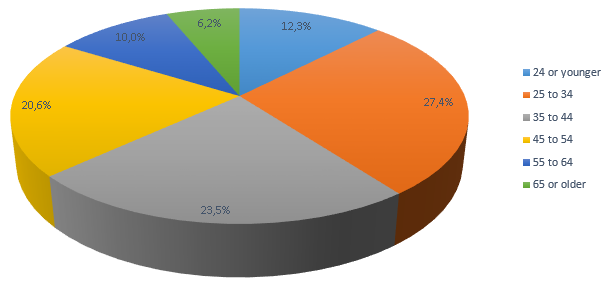
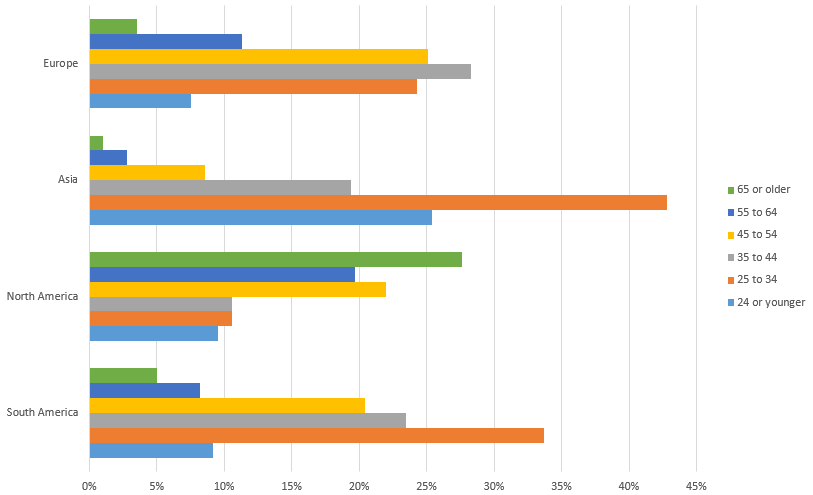
Age distribution by continent is shown below. Asia had the youngest respondents, with about 68% in the <25 and 25-34 brackets. North America had the oldest respondents, over 69% being in the 45-54, 55-64 or 65+ groups. South America had about 34% in the 25 to 34 age group and Europe had about 28% in the 35 to 44 age group.
Overall, 55.1% of users pay for a security solution. 0.5% of the users answered to do not use any security solution. In South America, most users (43%) use a Free Anti-Virus solution. In Asia, Free Internet Security Suites are very popular. Possibly due to the integration of the free Microsoft Windows Defender into Windows 10, compared to last year more people have moved to “Free Anti-Virus”.
The most widely used operating system amongst respondents is Windows 10, accounting for over 3/4 of the total OS usage. Windows 7 was the second most popular system, with about 17% of participants using it. In North America, MacOS/Apple is used more than in the rest of the world, with about 8% market share. Our review/test of Mac security products is available at https://www.av-comparatives.org/testmethod/mac-security-reviews/
A list of Mac security products can be found here: https://www.av-comparatives.org/list-of-av-vendors-mac/
As shown in the diagram, Google Chrome (45.6%) is the most popular browser amongst survey participants worldwide, with almost half of the respondents using it. In second place is Mozilla Firefox (29.2%). In third place we find Opera (10% in Europe). The Yandex browser is very popular in Russia (18%). Even though more than 70% of survey respondents use Windows 10, only 4.2% of all participants use the Edge browser (mostly in North- and South America – 8%). Only 1.3% of survey participants still use the Internet Explorer browser.
Android is the most popular mobile OS with our survey participants, accounting for over 80% of users worldwide. In North America, iOS is more popular than in other regions, accounting for over 26%. Our Mobile (Android) security review/test report is available at https://www.av-comparatives.org/testmethod/mobile-security-reviews/
An overview of security products for Android can be found here: https://www.av-comparatives.org/list-of-mobile-security-vendors-android/
60.5% of all respondents read emails in a browser using webmail services such as Gmail, outlook.com, or Yahoo. Webmail is most commonly used in Asia, where 70% of users employ it.
Microsoft Office Outlook is the most frequently used email client, with 19.8% of all users choosing it. It is particularly popular in North America, where it is used by exactly a quarter of respondents.
Mozilla Thunderbird is the next most commonly used mail program, accounting for 12.0% of all users. This rises to 18% in Europe.
4.2% of all users deploy Windows Live Mail, and 3.5% other email clients.
According to the survey, almost 45% of users overall make use of Virtual Private Network software (VPN).
VPNs are mostly used in Iran (95%), United Arab Emirates (87%), Iraq (84%), China (75%), Turkey 64% and Ukraine 60%. In most other countries only about a quarter to a third of users deploy a VPN. Interestingly, the countries in which VPNs have been banned, or bans have been attempted, are the ones in which they are most commonly used.
Below are the 20 most common responses:
| 1. Windscribe | 12.5% |
| 2. Opera VPN | 8.3% |
| 3. VPN of my employer/company OR self-hosted VPN | 6.5% |
| 4. Avira Phantom VPN | 6.4% |
| 5. Kaspersky VPN | 5.9% |
| 6. NordVPN | 4.5% |
| 7. CyberGhost | 3.5% |
| 8. Cisco AnyConnect | 3.3% |
| 9. F-Secure Freedome | 3.3% |
| 10. ProtonVPN | 3.3% |
| 11. ExpressVPN | 3.2% |
| 12. Avast SecureLine | 2.8% |
| 13. Private Internet Access | 2.2% |
| 14. AnchorFree Hotspot Shield | 1.8% |
| 15. Tunnelbear | 1.7% |
| 16. BrowSec | 1.4% |
| 17. TorGuard | 1.3% |
| 18. VPN Unlimited | 1.1% |
| 19. HideMyAss | 1.0% |
| 20. other VPN software | 26.0% |
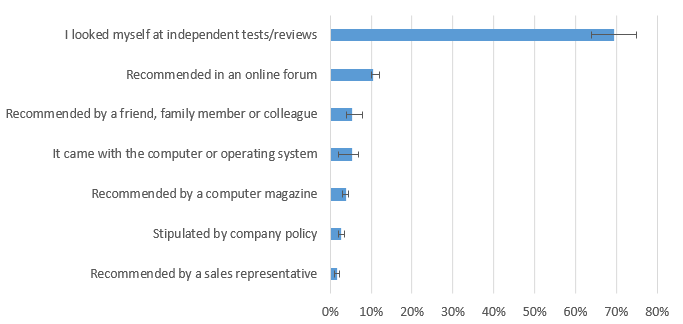
Survey respondents clearly value independent tests very highly when it comes to choosing security software, with almost three quarters using these to select their security solution. Recommendations in online forums and from friends/family members then account for most of the remainder. We should point out that some of the forum members/family members/friends etc. may themselves consult independent test-lab results before recommending a product. About 7% of users stick to the security solution that came with the computer or operating system. The chart above shows the answers from the last 5 years.
37.8% of respondents overall do not use any security solution on their mobile phones.
Worldwide, the ten most commonly used manufacturers of mobile security products are, in decreasing order: Kaspersky Lab, Bitdefender, ESET, Avast, Symantec, McAfee, F-Secure, AhnLab, AVIRA and AVG.
The list below shows the 10 most popular mobile security manufacturers used by survey participants, according to continent. There were not enough responses from some regions to produce significant results. Therefore, Australia/Oceania and Africa are not shown.
| Europe | North America | Asia | South/Central America |
|
|
|
|
Bitdefender and ESET were in the top three on all four continents with significant results, and Avast in the top four.
Major products for mobiles were reviewed by AV-Comparatives in a report in 2018.
AV-Comparatives offers a free scan service (AVC UnDroid) to check Android apps for suspicious traits. It is located at https://www.av-comparatives.org/specials/undroid/
Worldwide, the twelve manufacturers of anti-malware products for Windows platforms most commonly used by survey participants are (in this order): Kaspersky Lab, ESET, Bitdefender, Microsoft, Avast, Symantec, AVIRA, F-Secure, McAfee, Emsisoft, Panda and Trend Micro.
On all 4 continents, the same 5 vendors take the top 5 places. These are (alphabetically): Avast, Bitdefender, ESET, Kaspersky Lab and Microsoft.
Differences between continents
The table below shows the twelve products most commonly used by survey participants, by continent:
| Europe | North America | Asia | South/Central America |
|
|
|
|
Below are the 15 most-requested consumer/home-user products.
- Kaspersky Lab
- Bitdefender
- ESET
- Avast
- Microsoft
- AVIRA
- Symantec/Norton
- Trend Micro
- McAfee
- F-Secure
- Panda
- AVG
- Emsisoft
- VIPRE
- Tencent
Below are the 20 most-requested business/enterprise products.
- Kaspersky Lab
- ESET
- Bitdefender
- Symantec
- Avast
- Microsoft
- Trend Micro
- McAfee
- F-Secure
- Sophos
- Fortinet
- CrowdStrike
- Panda
- FireEye
- MalwareBytes
- Cylance
- CarbonBlack
- CISCO
- Palo Alto Networks
- Endgame
Most of the popular vendors are usually included in at least some of our public tests and reviews, while some other vendors commission separate tests and/or participate privately in certain tests.
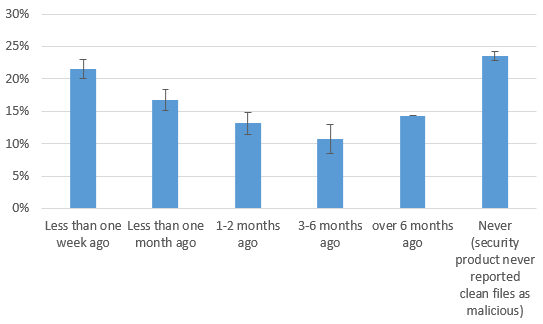
About 1/3 of the users state that they encountered malware and that their security product successfully protected their system less than a week ago. About 10% of the users said that the last time that their security product appropriately warned of/protected them against malware was over six months ago. About 8% have never had any warnings from their security product. The results of questions 14 and 15 together may provide some insight into the effectiveness of current security software.
When asked why the people think that the detection was a false positive, 28.2% answered that other security products did not detect the file/website as malicious. Almost as many (27.3%) said that they had used the file or website before, and believed it to be safe. A smaller proportion (16.2%) stated that the file/website link came from a trusted source, such as a computer magazine. One in ten users said that the AV vendor in question had admitted that the detection was a false positive, while 6% reported that they (or their company) had created the file, and thus new it to be safe. The remainder, about 10% altogether, concluded the file or website was safe based on information from trusted websites/magazines/family members/friends/colleagues.
Respondents ranked the tests in the following order of importance to them (1 being most important):
- “Real-World” Protection Test (vector WEB)
- Enhanced Real-World Test (Fileless/Exploit/Attack Test)
- Malware Protection Test (vector Network/USB)
- Performance (System Impact) Test
- False Alarm Test / False Positive Test
- Malware Removal (Disinfection) Test
From 2019 onwards, the Malware Removal Test will no longer be a part of our Public Main Test Series. In its place, we will be running the Enhanced Real-World Test.
Users had to rate various security product testing labs and institutes by giving a score from -2 to +2, where +2 meant reliable/trustworthy and -2 unreliable/biased. Note that not all respondents were aware of all the labs, so each lab was only rated by those who were aware of it. For more information, see next page.
AV-Comparatives and AV-Test reached a score higher than 1. Together with Virus Bulletin, those are the three best-known AV testing labs in the world. We hope that our high rating is down to the carefully prepared methodology of our tests, meaningful number of samples, transparency, and freely available test reports, which describe the tests in detail. Our willingness to allow other publications to cite our results (subject to proper attribution) also increases our visibility.
For products that are not tested by us, we recommend our readers to look at the tests done by other well-known testing labs or at least certification bodies. For a list of some other testing labs, go to http://www.av-comparatives.org/list-of-av-testing-labs/
Which are the best-known AV testing labs?
We asked which testing labs are known to the survey participants. Obviously, anybody who has seen our website, newsletter or social media accounts will be aware of AV-Comparatives. Consequently, for AV-Comparatives we removed the survey responses that came from via website, our newsletter and our social media accounts, to create a level playing field. Below you can see the percentages of participants that have heard of the respective labs:
Below the testing labs are ranked based on how well they are known on the various continents:
| Europe | North America | Asia | South/Central America |
|
|
|
|
CheckLab (AVLab) and Mitre are new entries; CheckVir has been removed as it appears to no longer exist (as of January 2019).
Please note that not all the testing labs have the same testing focus. That is to say, some may test only business products, others only consumer products; some may only provide certification (i.e. simply verify that products reach a certain minimum level, without providing comparative data); some may limit their tests to products from a particular country or region, or in a certain language.
Copyright and Disclaimer
This publication is Copyright © 2019 by AV-Comparatives ®. Any use of the results, etc. in whole or in part, is ONLY permitted after the explicit written agreement of the management board of AV-Comparatives prior to any publication. AV-Comparatives and its testers cannot be held liable for any damage or loss, which might occur as result of, or in connection with, the use of the information provided in this paper. We take every possible care to ensure the correctness of the basic data, but a liability for the correctness of the test results cannot be taken by any representative of AV-Comparatives. We do not give any guarantee of the correctness, completeness, or suitability for a specific purpose of any of the information/content provided at any given time. No one else involved in creating, producing or delivering test results shall be liable for any indirect, special or consequential damage, or loss of profits, arising out of, or related to, the use or inability to use, the services provided by the website, test documents or any related data.
For more information about AV-Comparatives and the testing methodologies, please visit our website.
AV-Comparatives
(February 2019)


